

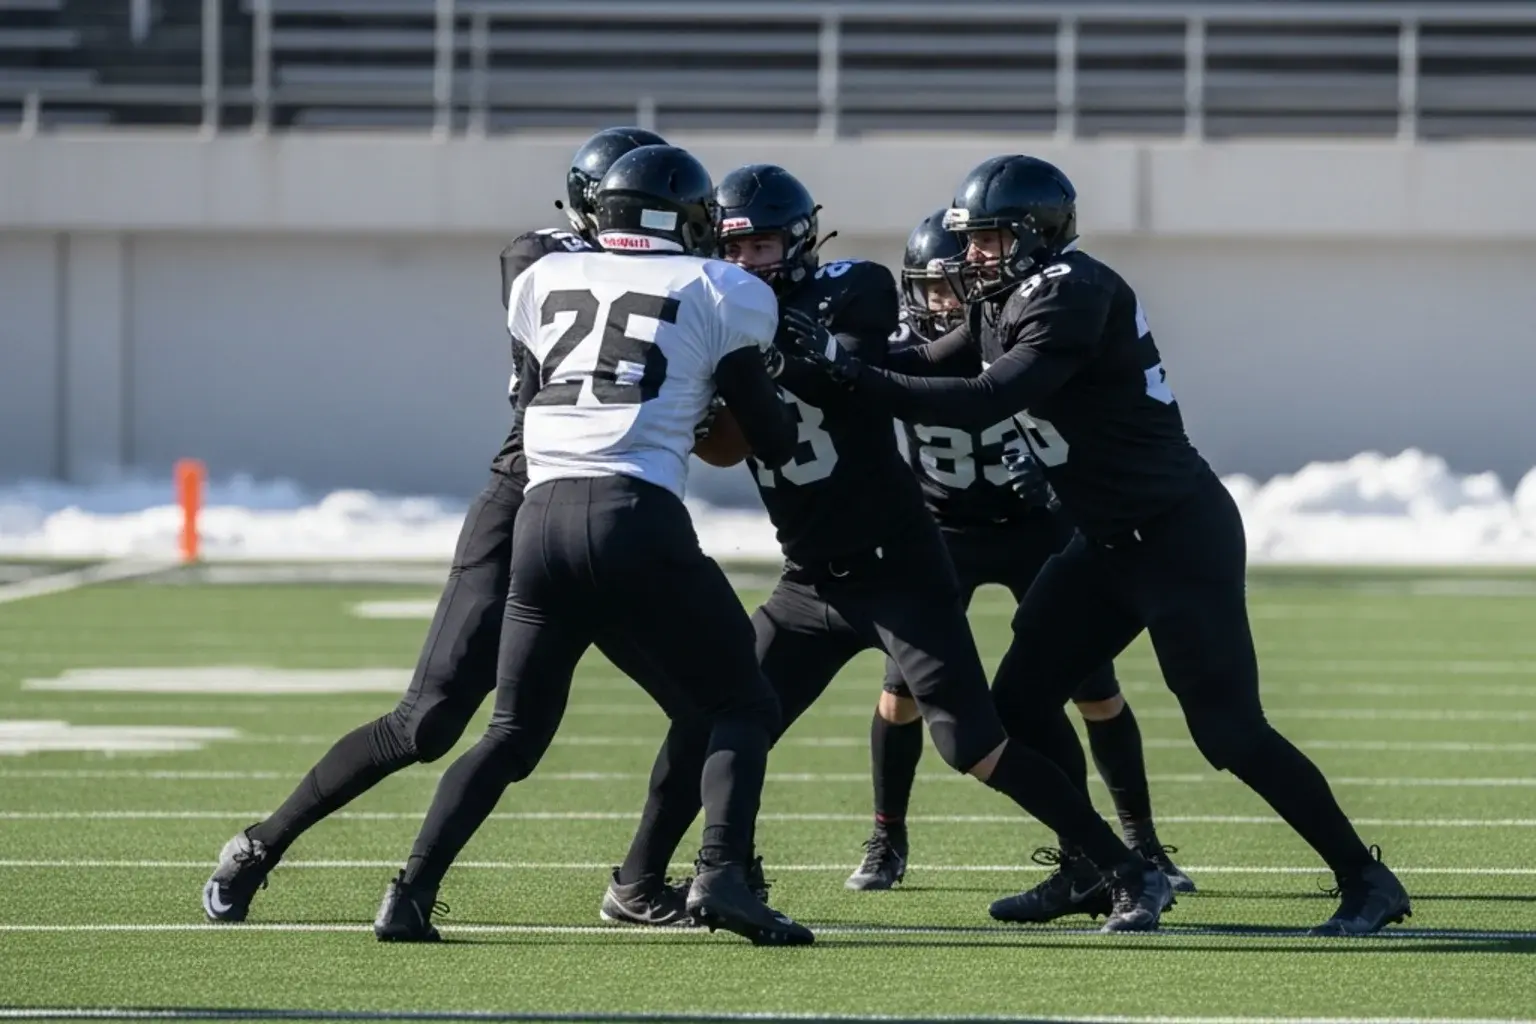
Postseason Dynamics: Adjusting Betting Models for NFL Playoff Spreads
The first playoff slate I bet seriously was a disaster. I’d had a profitable regular season – won maybe 54% of my spread bets, beat the closing line consistently, felt like I had the market figured out. Wild Card weekend hit and I went 1-5. Divisional round, 2-2. By the conference championships I’d given back most of my regular-season profit. The lesson I took away wasn’t that I was bad at handicapping, exactly. It was that playoff football is a different market with different dynamics, and the heuristics that work in Weeks 1-17 don’t always survive into January.
The basic problem: playoff games involve the league’s best teams playing in elimination format, with full game-planning weeks, with healthy stars, and with high motivation on both sides. The variance distribution narrows compared to regular-season games, which means upsets are less common at the spread level but more painful when they hit. The market knows all this. The market prices accordingly. Your edge against the market needs to be bigger to compensate.
This is the working guide for a UK punter navigating the playoffs. Bracket structure, market-by-market pricing differences, how lines move through the tournament, and where the genuine edge actually sits versus where it just feels like edge.
Playoff bracket structure for bettors
The current NFL playoff structure has 14 teams qualifying – seven from each conference. The number-one seed in each conference gets a first-round bye; seeds 2-7 play in Wild Card weekend, with 2 hosting 7, 3 hosting 6, and 4 hosting 5. The winners of Wild Card games advance to the Divisional Round, where they meet the top seed and the highest remaining seed plays the lowest. Divisional winners meet in the Conference Championship. Conference Champions meet in the Super Bowl.
Three structural facts matter for betting. Home-field advantage in the playoffs is real but smaller than in the regular season – playoff visitors are typically professionals who’ve earned their spot and travel well. The empirical home-field edge in playoff games sits around 2-2.5 points spread-equivalent, versus 2.5-3 points in the regular season. Second, the bye week for top seeds is a double-edged sword. Top seeds enter the Divisional Round well-rested but also potentially rusty after two weeks off, and the divisional round upset rate for top seeds against rested division-winning opponents is meaningfully higher than the regular-season comparison would suggest.
Third, the rest differential matters. When a team plays Wild Card weekend and then has six days to prepare for the Divisional Round, they’re at a meaningful preparation disadvantage against a top seed who’s had a full bye. Lines reflect this, but they may not reflect it fully – there’s persistent edge in fading short-rest playoff teams against well-rested opponents on a year-by-year basis.
The 2025 NFL regular season’s $30 billion handle in the US was concentrated heavily in the playoffs, with the postseason being the highest per-game betting volume of the year. That depth of liquidity tightens spreads and totals to their most efficient point of the season – which is why playoff edge is harder to find, and why staking discipline matters more.
Wild Card weekend markets
Wild Card weekend features six games over three days (Saturday and Sunday Wild Card weekend, plus a Monday Night Football game in recent format changes). The matchups are seeds 2v7, 3v6, 4v5 in each conference. The pricing pattern: 2-seeds are typically 7- to 10-point favourites over 7-seeds. 3-seeds are typically 3- to 6-point favourites over 6-seeds. The 4v5 matchup is often a pick’em or within 3 points either way, because the seeding difference here is often a tiebreaker rather than a genuine talent gap.
The historical edge in Wild Card weekend has come from fading the heavy favourites against the spread. Big spreads in the playoffs are harder to cover than equivalent regular-season spreads because both teams are well-coached, motivated, and willing to play conservatively to keep games close. A 10-point regular-season favourite covers at about the same rate as the spread implies. A 10-point playoff favourite covers at a noticeably lower rate, because trailing playoff teams play to stay in the game rather than to close margins. The 2025 regular season’s 47.8% favourite cover rate against the spread was an extreme version of this pattern – playoff dynamics that compress winning margins were arguably present in the regular season too.
Totals in Wild Card games skew slightly under their regular-season equivalents. The combination of better defences (playoff teams are mostly above-average defensively), more conservative play-calling on third downs, and weather risk for outdoor January games in cold-weather cities all push the total slightly downward relative to where two teams’ regular-season averages would put it. UK bettors who can do their own analysis on weather forecasts for outdoor Wild Card games have a small edge on totals, especially in cities with predictable late-game wind patterns.
Player props in Wild Card games are softer than regular-season player props because game-planning effects are larger. Defences spend full weeks preparing specifically for one offence, and the resulting play-distribution shifts can dramatically change player usage. A wide receiver who saw 8 targets per regular-season game might see 4 or 12 in a Wild Card game depending on coverage scheme – and the prop market doesn’t always price the variance correctly.
Divisional and Conference rounds
The Divisional Round narrows to four games over two days, with the four top seeds entering fresh from their bye. The pricing dynamic shifts. Spreads are tighter – most divisional games are within 6 points either way, with the exceptions being top seeds against banged-up wild card winners. The rest differential I mentioned earlier shows up here: well-rested top seeds get a small spread bump versus the regular-season expectation, and short-rest road teams from Wild Card weekend often play below market expectation.
This is the round where the market is sharpest. The trading desks have had two weeks of data on the Wild Card survivors. Sharp money concentrates here because the games are high-stakes and the betting limits are at season highs. The 2025 regular-season trend of favourites underperforming the spread (47.8% cover) may or may not carry into the playoffs in any given year – but the structural dynamics of playoff football (well-coached underdogs playing to stay close, motivated favourites managing variance rather than maximising it) consistently push toward spread compression.
The Conference Championships are the two-game weekend where the AFC and NFC winners are decided. Each game features either two top seeds, or a top seed against the upset survivor, or in rare years two upset survivors. Spreads here are usually 3 to 7 points, with the home team getting a slight edge from home-field advantage that’s typically priced in but sometimes underpriced relative to the actual conference final track record.
One pattern worth tracking: the better-rested conference championship team has a meaningful spread-covering edge. When one conference final involves a team that came off a more competitive divisional round game and the other involves a team that won decisively, the latter is often a better spread bet at the offered number. This is observable but it’s also priced in – the edge is shrinking as more analysts publish on this pattern. Use it as a tiebreaker, not a primary thesis. The conference championship winners go on to the Super Bowl, where market dynamics shift again into the highest-volume single event of the betting calendar.
How playoff pricing differs from regular season
Three differences matter most. First, spread compression. Across the playoff sample, spread covers cluster closer to 50/50 than in the regular season, even for big favourites. The 2025 regular-season anomaly of 47.8% favourite covers was the kind of distribution playoff dynamics produce naturally. Bookmakers know this and adjust by tightening lines – playoff spreads at lower numbers than the team-strength differential would suggest in the regular season.
Second, total adjustment. Playoff totals are systematically lower than what you’d get by averaging the two teams’ regular-season totals. This reflects better defences (only playoff-quality teams advance), conservative late-game playcalling, and weather effects for outdoor games. Smart bettors who track this pattern have a small persistent edge on unders in cold-weather outdoor playoff games, though the edge has narrowed as bookmakers have priced it in.
Third, public bias is more aggressive in the playoffs. Casual bettors who haven’t watched closely all season suddenly have opinions in January. The result is heavier public action on popular teams, on prime-time games, and on traditional rivalries. Sharp money is the counterweight, and the public/sharp split shows up more starkly in playoff line movement than in regular-season games. Reverse line movement is a particularly useful signal in the playoffs because the public action is heavy enough that any move against it is unambiguous sharp positioning.
The other dynamic specific to playoffs: futures market interaction. Conference and Super Bowl futures markets reprice continuously through the playoffs, and savvy bettors hedge live futures positions against individual playoff games. A holder of a long-shot Super Bowl futures ticket can hedge their conference championship game to lock in profit if their team makes the Super Bowl, or to cut losses if they don’t. The interplay between game-level betting and active futures positions creates correlation effects that experienced playoff bettors learn to manage. The pricing model on those futures and how positions move through the tournament is covered in detail in the futures betting guide elsewhere in this analysis.